
Many years ago, I was looking for a plug-in style power meter to monitor the power consumption of various devices in my house. A quick search around for such a gadget at the time led me to the Arlec PC222 ‘Energy Cost Meter’ which I acquired from Bunnings. Jaycar also sell the same device just with a different model number – the MS6115 (likely a white label product?). Both of these used to be similarly priced at around $20, but it seems like Bunnings has upped to price at $35.68 (at the time of writing).
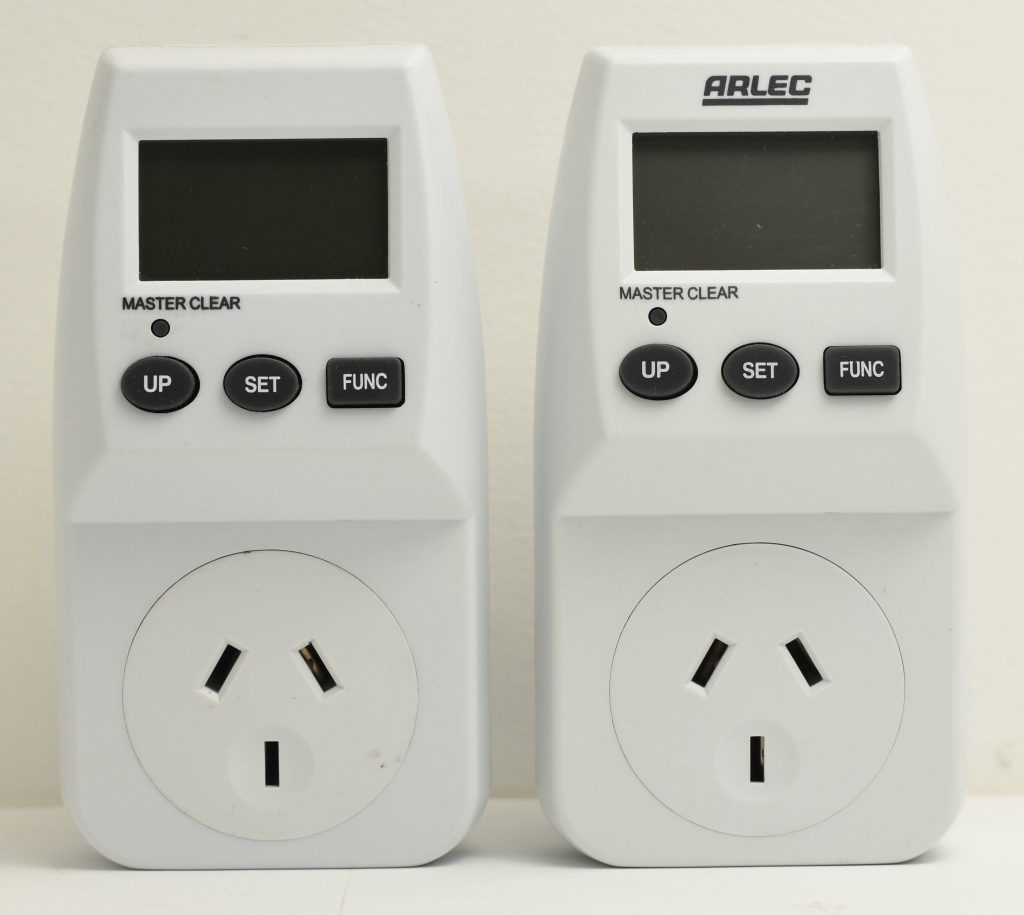
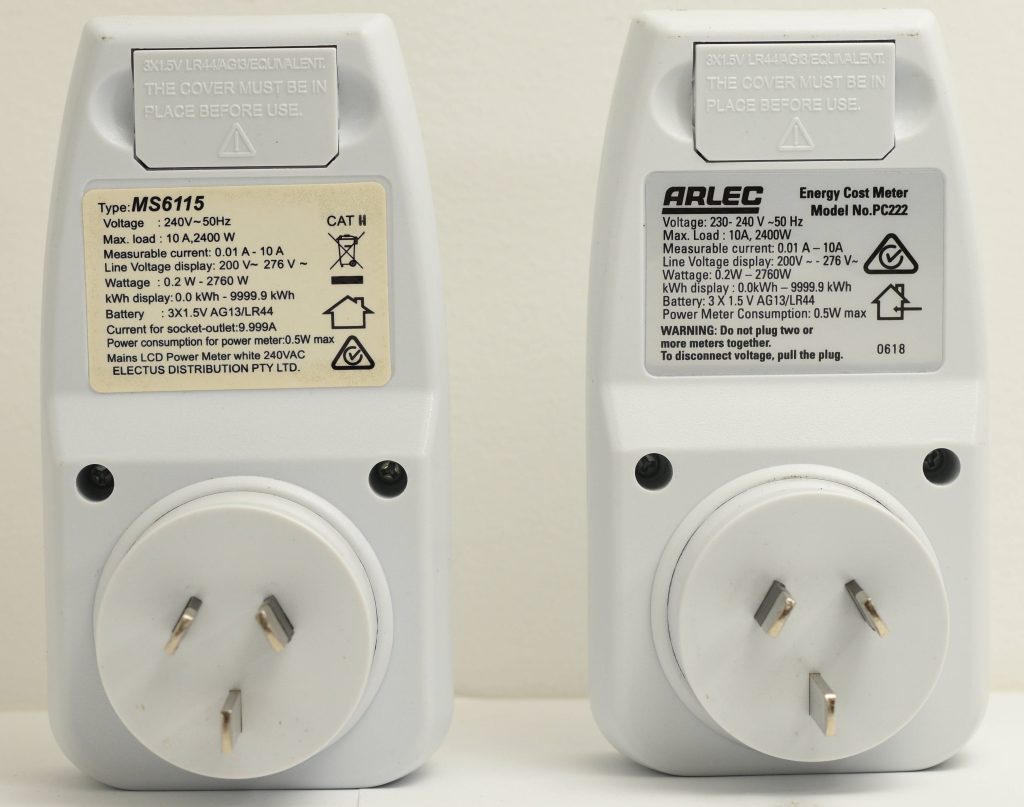
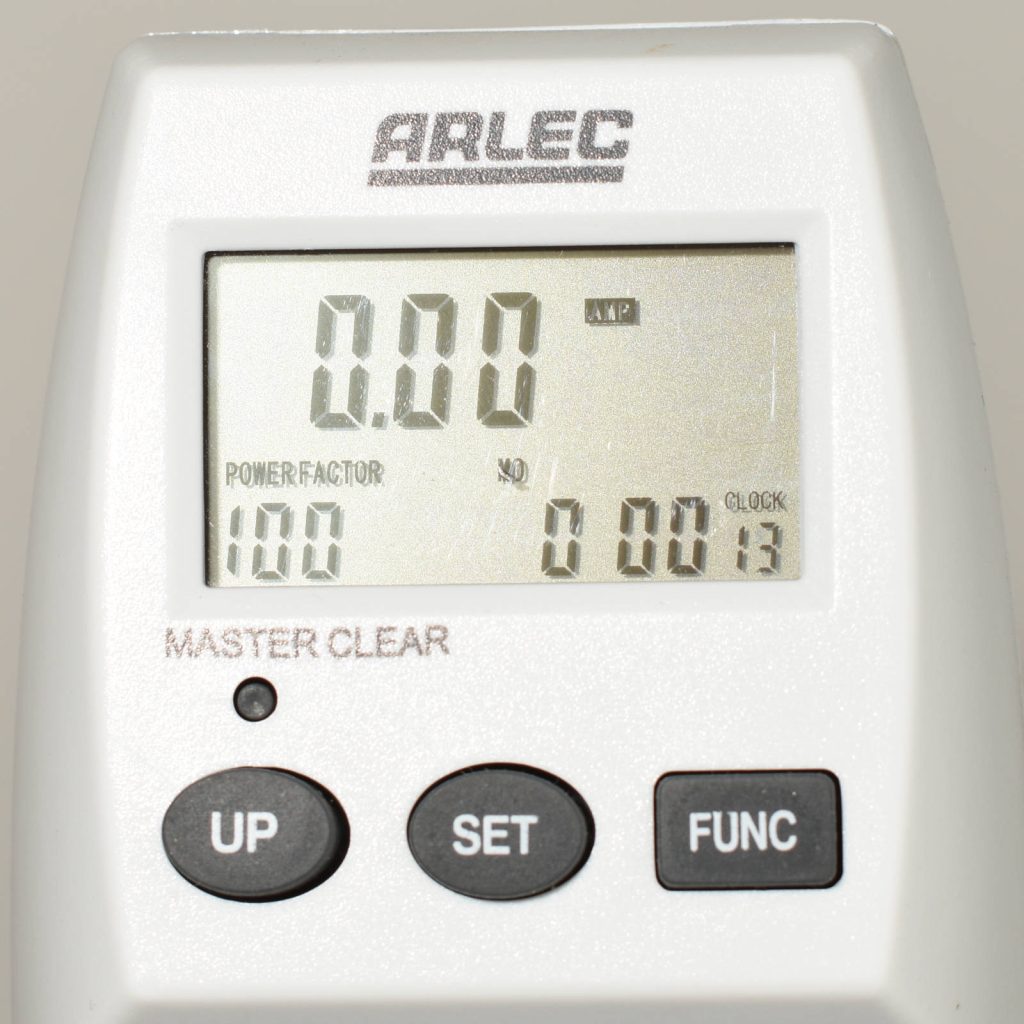
From a user interface point of view, it is not the most intuitive initially with only 3 main buttons. The manual itself can also seem a bit intimidating with the wall of text. However once you set it up once you actually get quite used to it, scrolling through the menus and so on. The LCD screen is also not easy to read off-centre or in dim environments. I measured the self power consumption of this meter is around 0.5W which is within the margin of error of the claimed 0.3W.
In this blog post, I will be focusing on the measurement accuracy of this power meter as that is the main purpose of a power meter. After all, what good would it be if it didn’t measure accurately?
Accuracy tests
The unit can measure the following metrics:
- Voltage
- Frequency
- Current
- Power factor (as a %)
- Energy used (kWh and $)
Now let’s take a look at the meter’s accuracy on measuring voltage, frequency, current, and power factor.
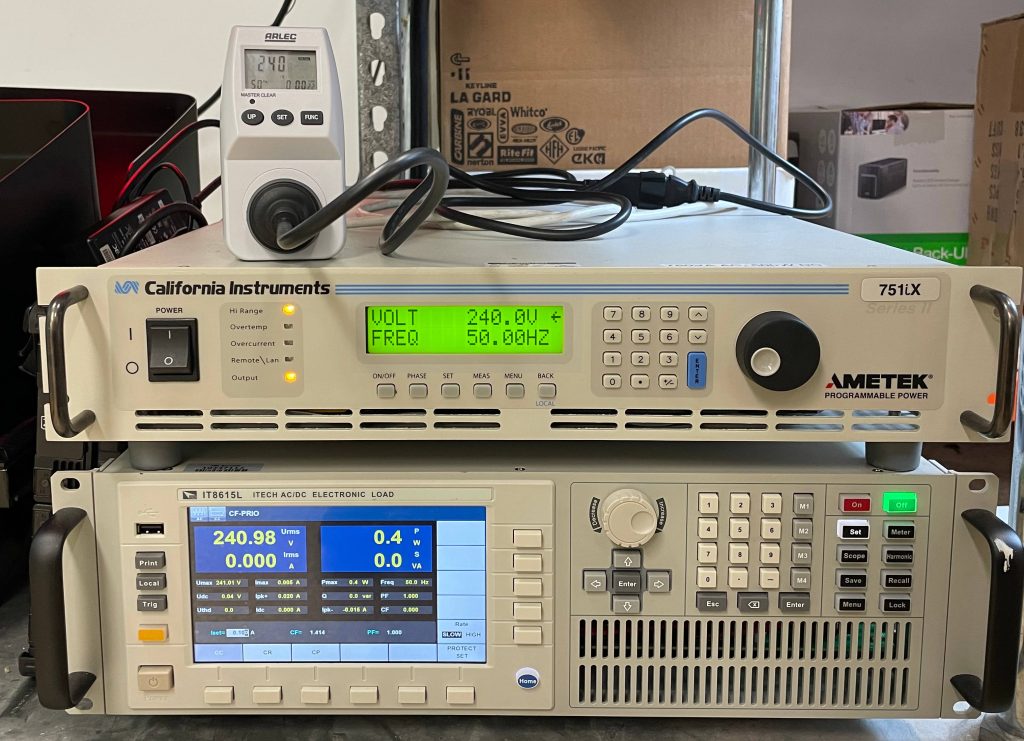
For the AC power supply, I am using a California Instruments 751iX and for the electronic load I am using an ITECH IT8615L. The test set-up will involve connecting the electronic load through the power meter to the power supply.
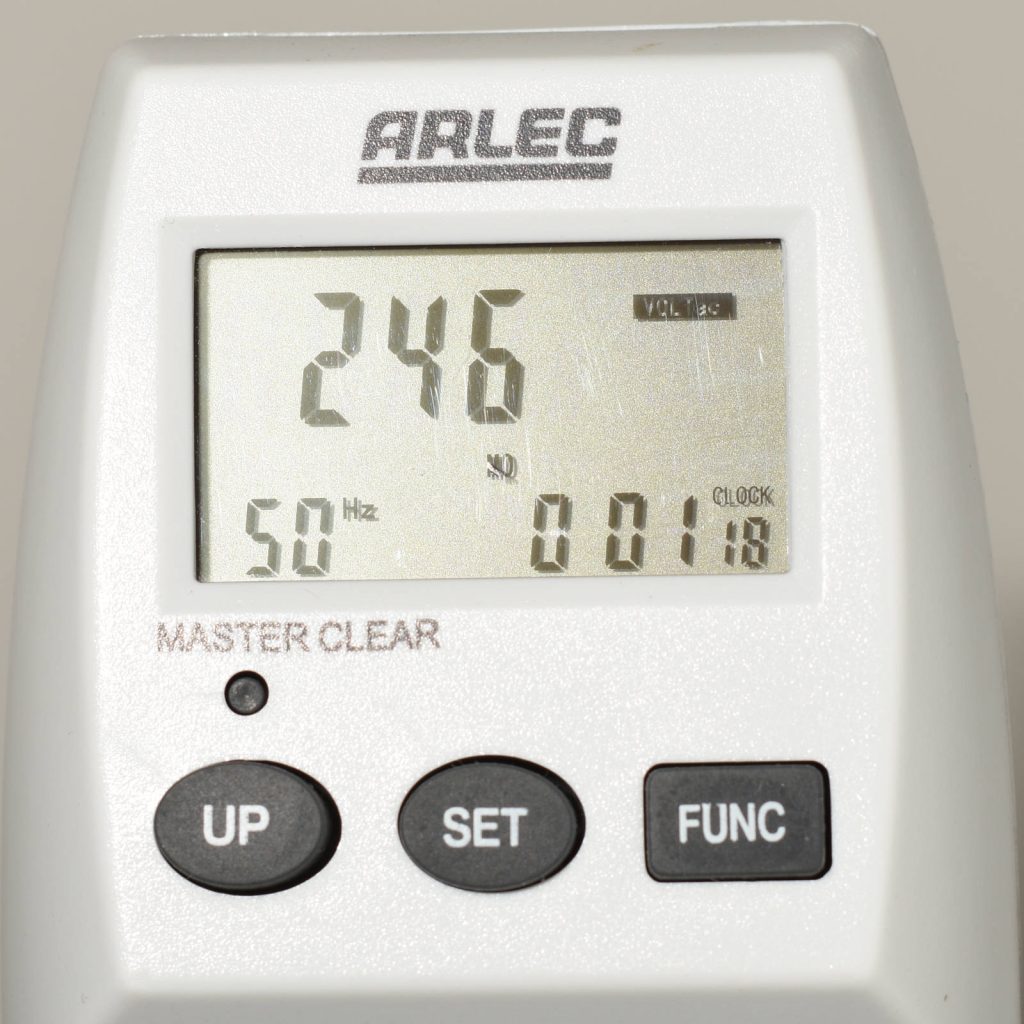
Voltage
The meter claims an approximate voltage measurement range of 200V to 276V. To test this, I configured the power supply to output a sine wave at 50 Hz and varied the output voltage in 10V increments. No load was connected to the power meter. The results are recorded in Table 1 below.
| Set voltage (V) | Measured voltage (V) |
|---|---|
| 200 | 200 |
| 210 | 210 |
| 220 | 220 |
| 230 | 230 |
| 240 | 240 |
| 250 | 250 |
| 260 | 261 |
| 270 | 271 |
| 280 | 281 |
Current
Next we move on to current measurements. The meter can supposedly measure from 0.01A to 10A, but my electronic load can only do a minimum load of 0.1A in CC mode so that is where I’m starting my test from. Technically, the IT8615L can do lower loads in CP mode, however accuracy is not ideal (e.g. power factor is well below 1).
Results are tabulated in Table 2 below. Note that, as my power supply can only a maximum of 3.25A, I had to switch over to mains from 3A onwards. At the time of testing, mains voltage was 251.5V with the meter logging 251V.
| Set current (A) | Measured current (A) |
|---|---|
| 0.10 | 0.10 |
| 0.20 | 0.19 |
| 0.30 | 0.29 |
| 0.40 | 0.40 |
| 0.50 | 0.50 |
| 0.60 | 0.59 |
| 0.70 | 0.69 |
| 0.80 | 0.79 |
| 0.90 | 0.89 |
| 1.00 | 0.99 |
| … | … |
| 9.0 | 9.00 |
| 9.5 | 9.50 |
| 10.0 | 10.00 |
Overall, these results look excellent. I have omitted the results between 1A and 9A as they followed the same trend as the other measurements – either reading spot on of 10mA below the setpoint. Throughout the range, we see the meter only measures ever so slightly under in some cases. This difference is also within the electronic load’s tolerance so the meter could have very well been reading the actual current drawn as opposed to the setpoint.
Internally, the meter has more precision than the displayed values. This is evidenced by the meter being capable of displaying lower power readings (Table 3) while the current reading is still ‘zero’.
| Set load (W) | Measured load (W) | Measured current (A) |
|---|---|---|
| 0.5 | 0.5 | 0.00 |
| 1.0 | 0.8 | 0.00 |
| 1.5 | 1.3 | 0.00 |
| 2.0 | 2.0 | 0.01 |
| 3.0 | 2.9 | 0.01 |
Power factor
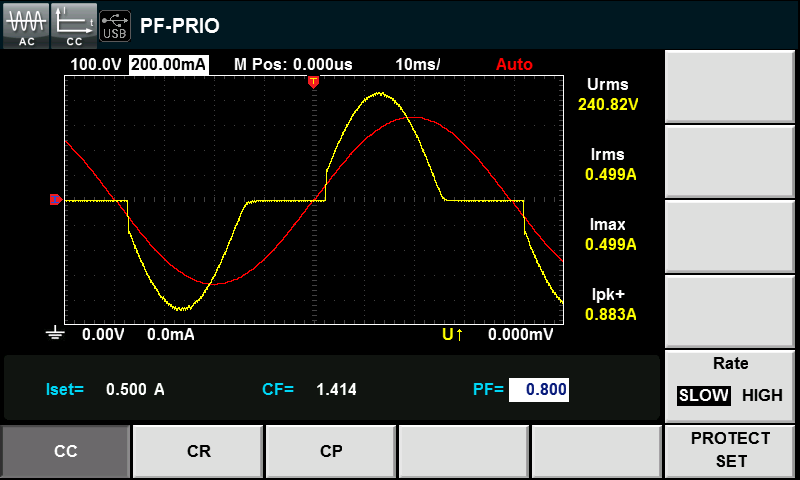
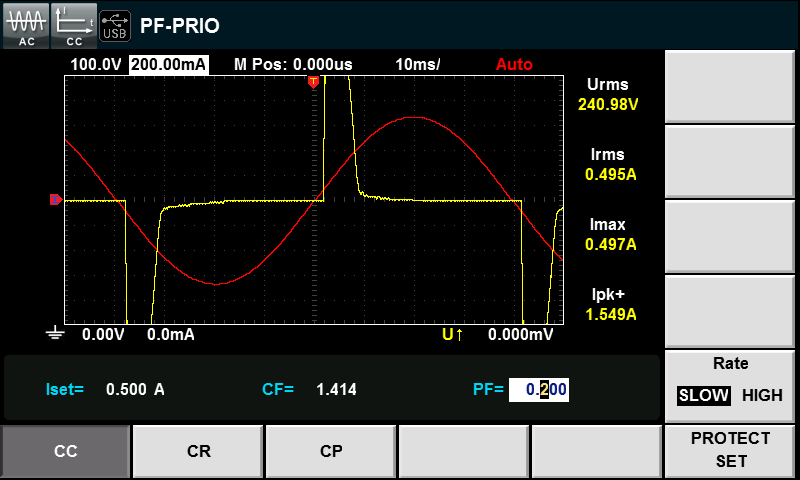
As an added bonus, the meter can measure power factor and scales the reading between 0 and 100. On the electronic load, one can configure the power factor which in term will affect the shape of the current waveform. As the power factor is lowered, the current waveform becomes ‘spikier’.
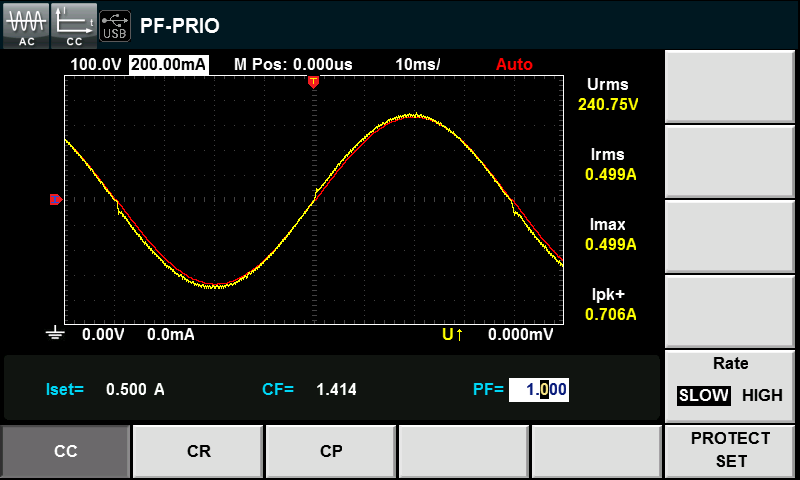
As devices with low power factor tend to also draw less power (e.g. your phone charger), I decided to test the power factor readings at two different load levels – 0.1A and 1.0A – to see how the accuracy would vary. I elected to use the power supply in this instance for a more controlled source.
In the first round, I set a constant current load of 0.1A while varying the power factor from 1.0 to 0.1. Results are shown below in Table 4.
Unlike the previous two tests, there was a decent different between the set power factor and the actual power factor as measured on the load’s internal meter. I have therefore included this reading as well (otherwise, the accuracy of the meter would be portrayed incorrectly).
Tests conducted with a 240V, 50Hz sine wave and a 0.1A constant current load.
| Set power factor | Actual power factor | Meter power factor |
|---|---|---|
| 1.0 | 0.974 | 99 |
| 0.9 | 0.860 | 87 |
| 0.8 | 0.771 | 77 |
| 0.7 | 0.688 | 70 |
| 0.6 | 0.606 | 61 |
| 0.5 | 0.524 | 52 |
| 0.4 | 0.446 | 48 |
| 0.3 | 0.367 | 40 |
| 0.2 | 0.286 | 31 |
| 0.1 | 0.203 | 21 |
That’s not too shabby at all. Now let’s have a look at what the accuracies are like with a 1A load.
Tests conducted 240V, 50Hz sine wave with a 1.0A constant current load.
| Set power factor | Actual power factor | Meter power factor |
|---|---|---|
| 1.0 | 1.000 | 100 |
| 0.9 | 0.903 | 90 |
| 0.8 | 0.806 | 81 |
| 0.7 | 0.709 | 71 |
| 0.6 | 0.613 | 61 |
| 0.5 | 0.514 | 52 |
| 0.4 | 0.419 | 42 |
| 0.3 | 0.320 | 32 |
| 0.2 | 0.220 | 22 |
| 0.1 | 0.116 | 11 |
With a higher load, we see that the meter’s accuracy increases slightly, presumably due to lower errors in reading lower amplitude waveforms.
Frequency
Finally, we will be assessing the frequency reading accuracy on the meter. The frequency of the grid is usually very well controlled and deviations tend to be much below 1 Hz. So, as the meter only has a frequency resolution down to the ones, such variations would not be captured. Nonetheless, I decided to test how well minor fluctuations in frequencies would be captured by the meter. The results are presented below in Table 6.
| Set frequency (Hz) | Measured frequency (Hz) |
|---|---|
| 49.0 | 48/49 |
| 49.2 | 50 |
| 49.5 | 50 |
| 50.0 | 50 |
| 50.5 | 50 |
| 50.9 | 50 |
| 51.0 | 51 |
We see that, for the most part, the meter tends read at 50 Hz when the input frequency varies from 49Hz to 51Hz. Originally, I thought the meter would round to the nearest ten, but it would seem like that is not the case. Whether or not this is due to inaccuracies or rounding is unknown.
Energy usage and cost
In this test, I did not analyse the accuracy of the energy metering aspect. If I get some more time in the future, I may revisit this.
Conclusion
I like to think of gadgets like this as indicative rather than precision instruments, and in that regard the meter lives up to its name. The interface may not be the most intuitive and the screen isn’t easiest to read, but it performs well and fits my use case. It’s also helped me understand the behaviour of some of my electrical products. For example,
- The effectiveness of the ErP BIOS setting at lowering standby power (5W -> 0.5W)
- The start-up power draw of my Dyson AM05 heater (momentary peaks over 3kW!)
- Discovering a bug in the Dell U2518D monitor where if the input is set to mDP, the display does not actually go to sleep (power draw does not drop when screen is blank)